Even before the polls opened on Election Day, we knew New Hampshire was poised for record-breaking absentee ballot numbers. Now, we have the data to better understand how expanded absentee eligibility affected voting patterns in the September state primary.
To skip ahead to interactive charts and other graphics, follow the links below:
- Map: How Much of Your Local Electorate Voted Absentee?
- How Did Absentee Voting Differ Along Party Lines?
- How Does the 2020 State Primary Compare to 2016?
- Searchable Database: Voting Patterns By Community
Until this spring, when the COVID-19 pandemic prompted a change in the state’s election policies, New Hampshire voters could only request absentee ballots in limited circumstances: If they had religious, professional or caregiving obligations, for example, or if they had plans to be out of town on Election Day. This year, however, state officials granted absentee eligibility to any New Hampshire voter concerned about COVID-19.
That policy change, we now know, helped to drive record turnout in the September state primary: 304,671 ballots were cast statewide, and just shy of 30 percent of those were absentee. That eclipsed the previous state primary turnout record set in the 2018 midterms, when 228,432 voters participated, with only about 4 percent of them absentee.
Newly tallied data from the New Hampshire Secretary of State gives a glimpse into which communities were most impacted by the expansion of absentee voting, how absentee ballot use broke down along party lines and how this compares to the last presidential election season in 2016.

While it’s hard to draw sweeping conclusions based on any one election, several things stand out.
A lot of voters still preferred to cast their ballots the old-fashioned way. Absentee voters made up a majority of the electorate in just 10 communities: Randolph, Sanbornton, Hanover, Orford, Durham, Lyme, Rye, Sandwich, Conway and New Castle. But that didn’t mean these, or other communities, were off the hook for processing lots of absentee paperwork. Several cities and large towns (Manchester, Nashua, Concord, Portsmouth, Bedford and Dover) fielded upwards of 2,000 absentee ballots — in addition to thousands of in-person voters. To put that into perspective: No community handled more than 850 absentee ballots in the 2016 state primary.
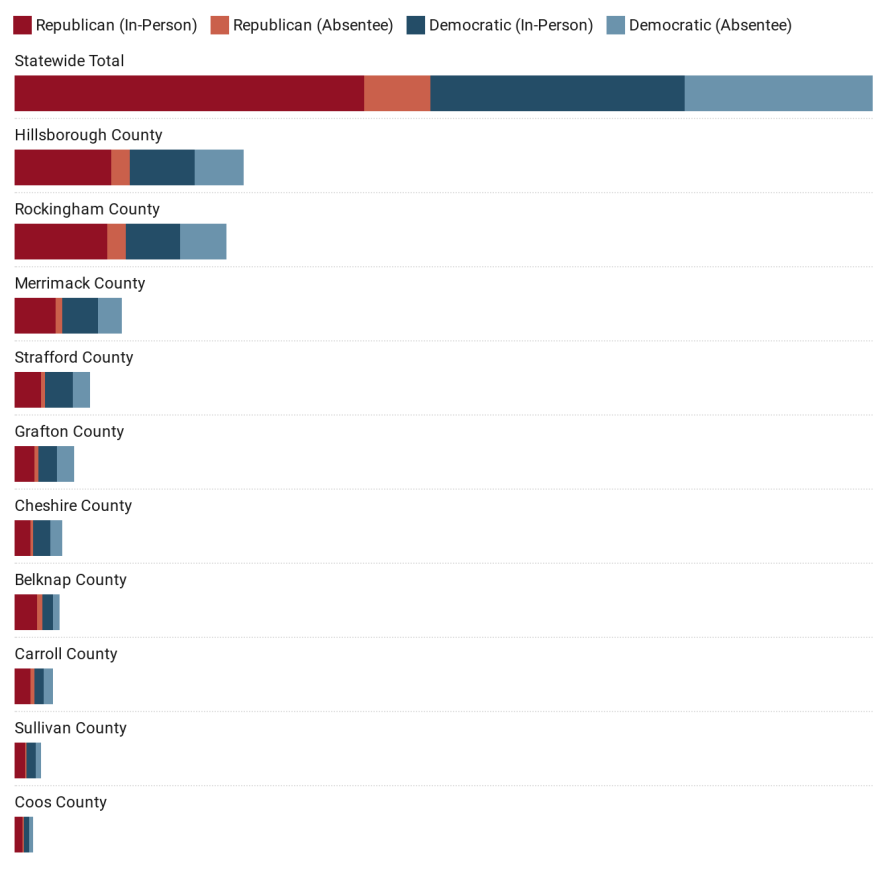
There’s also a big partisan gap in who’s using absentee ballots this year: Statewide, about 42 percent of Democrats voted absentee, compared to 16 percent of Republicans. Republicans in Belknap and Carroll counties voted absentee at a slightly higher rate than Republicans elsewhere, and Democrats in Carroll and Grafton counties did the same.
At the same time, though, voters of both parties showed a lot more interest in absentee voting than in past elections. In the 2016 state primary, absentee ballots were used by just 6 percent of Democrats and 4 percent of Republicans.
It’s hard to say what this means for November — or for the future of New Hampshire voting policy in the long-term. A recent Granite State Poll from the University of New Hampshire Survey Center found that a growing number of voters from both parties support offering absentee voting as an option during the pandemic, though most respondents in the same poll — Republicans and Democrats — said they planned to vote in-person for the general election. One safe conclusion to draw in all of this, perhaps: Even when it comes to how they cast a ballot, New Hampshire voters like to keep their options open.
Scroll through the charts below to learn more about the voting patterns in the 2020 state primary and how they compare to the same election in 2016.
Map: How Much of Your Local Electorate Voted Absentee?
If you're having trouble viewing the image below, click here to open it in a new window.
How Did Absentee Voting Differ Along Party Lines?
If you're having trouble viewing the chart below, click here to open it in a new window.
How Does the 2020 State Primary Compare to 2016?
If you're having trouble viewing the chart below, click here to open it in a new window.
Explore the Data: Voting Patterns By Community
If you're having trouble viewing the chart below, click here to open it in a new window.


