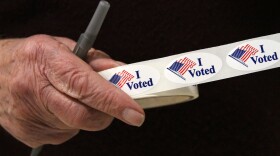
Expanded absentee voting eligibility was expected to reshape voting patterns in New Hampshire in this year's elections. New numbers from the Secretary of State make the scale of that shift clear, with New Hampshire seeing both record turnout and a huge jump in the rate of absentee voting this year.
Statewide, about 32 percent of Granite Staters cast an absentee ballot in the 2020 general election, up from about 10 percent four years ago.
In 2016, Hart’s Location reported the highest percentage of absentee ballots in the state, at 41 percent. (Granted, that was only out of about 39 total voters.) The highest raw absentee vote total reported in 2016 came from Manchester (with a little over 4,200) and Nashua (with a little under 3,500), but the vast majority saw only a few hundred absentee voters each - if even that.
But in 2020, absentee voters made up more than half of the electorate in eight communities, of varying sizes: Hanover, Randolph, Rye, Hale’s Location, Stratham, Bedford, Lyme and Millsfield. More than 60 communities logged more than 1,000 absentee ballots each. The state’s two largest cities, Manchester and Nashua, each reported more than 14,000.
About 127,000 fewer people chose to vote in-person this year than in 2016. By comparison, the number of absentee ballots grew by about 185,000. And that growth helped the state break a voter turnout record previously set in 2016.
Explore the charts below for more insight into New Hampshire voting patterns in the latest election.
(Editor's Note: This post was updated on Nov. 12 to reflect small revisions in the vote totals reported for several communities for the 2020 general election, and the absentee total for Peterborough for the 2016 general election. Due to an error in the numbers reported by the Secretary of State's office, an earlier version of this story also included incorrect 2016 absentee voting statistics for the town of Peterborough. We verified the correct figure directly with the Peterborough town clerk and updated the charts below accordingly.)
Ballots Cast in Last Four General Elections
If you're having trouble viewing the chart below, click here to open it in a new window.
How Many Cast A Ballot As A Share of N.H.'s Voting Age or Voting Eligible Population?
If you're having trouble viewing the chart below, click here to open it in a new window.
Interactive Map: How Many Voted Absentee In Your Community?
If you're having trouble viewing the chart below, click here to open it in a new window.
Explore the Data: Ballots Cast in 2020
If you're having trouble viewing the chart below, click here to open it in a new window.


