Editors Note: We updated this post to include new state level guidance on indoor masking for schools
Between the updated CDC masking guidance released in July, the new, more limited eviction moratorium, and updated state guidance for masking in New Hampshire schools, levels of community transmission of COVID-19 have become more central in federal and local policymaking in New Hampshire.
A map from the Centers for Disease Control and Prevention (CDC) shows Coos County with high rates of community transmission, and all other counties with substantial rates.
Stay In The Know: Sign up for NHPR's Rundown newsletter.
In areas with substantial or high levels of COVID-19 community transmission, a return to mask-wearing indoors, even for the fully vaccinated, is recommended by the CDC, and evictions in those counties have been paused.
As N.H. schools prepare for the fall amidst a rise in COVID-19 cases, updated state guidance for masking in schools was released this week.
While the state is not mandating masking, they are offering schools an approach on how to implement indoor face mask use through a “Decision Matrix.”
The matrix suggests looking at factors like state calculated rates of community transmission, facility outbreaks, vaccination rates, and the ability of schools to incorporate other COVID-19 safety protocols.

But New Hampshire and the CDC measure community transmission levels slightly differently.
Depending on the source, a county may have a different level of transmission. CDC guidance for masking and the eviction moratorium follows the CDC’s map. Local N.H. school recommendations follow the state's map.
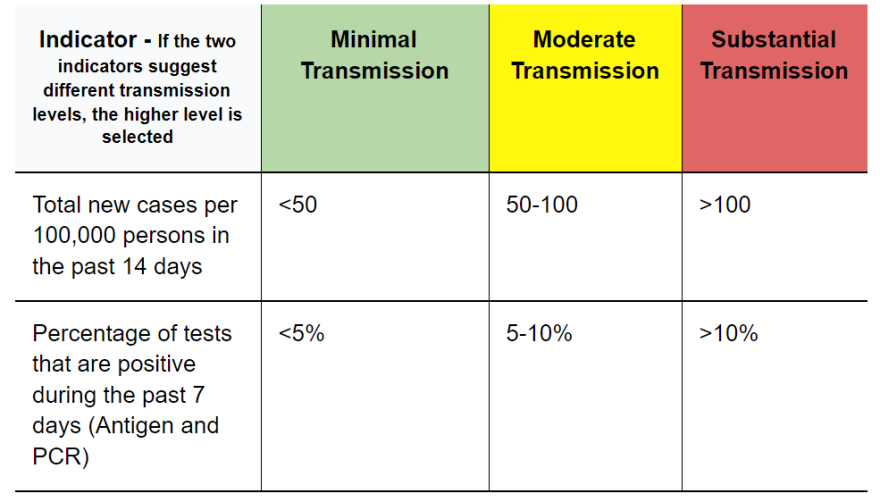
Both the CDC and the State of New Hampshire use two metrics to measure community transmission levels; test positivity rate and new cases. In both maps, if the two indicators suggest different transmission levels, the higher level is selected. Metrics like vaccinations, hospitalizations, or deaths are not included.
Why does the CDC map look different than the state's map?
- The CDC has four levels of community transmission; low, moderate, substantial and high. The state of New Hampshire has three levels; minimal, moderate, and substantial.
- The CDC uses the new case rate per 100,000 residents from the last seven days while New Hampshire includes the last fourteen days.
- The CDC only includes test results from the most reliable methods of COVID-19 testing like PCR tests. New Hampshire includes the rate from both PCR and antigen tests.


We're continuing our coverage of COVID-19 and the vaccination effort in New Hampshire. Questions about this story? Reach out to voices@nhpr.org.


